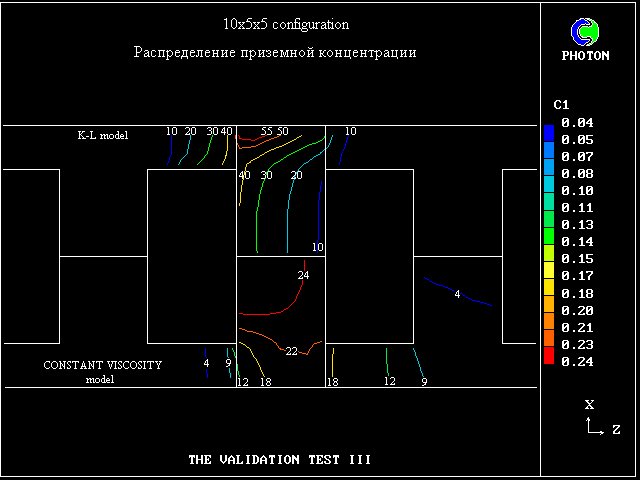
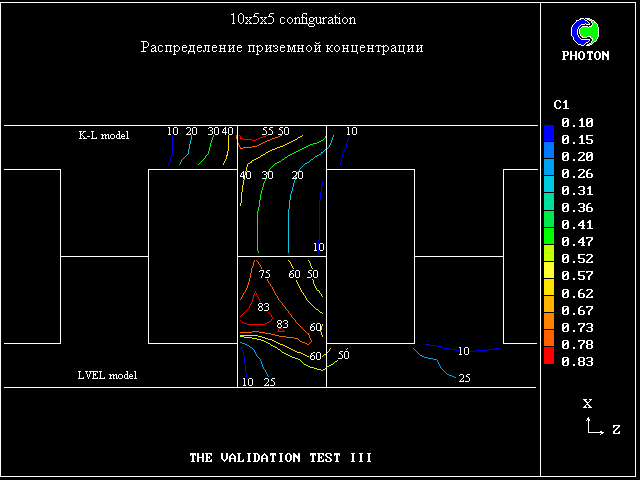
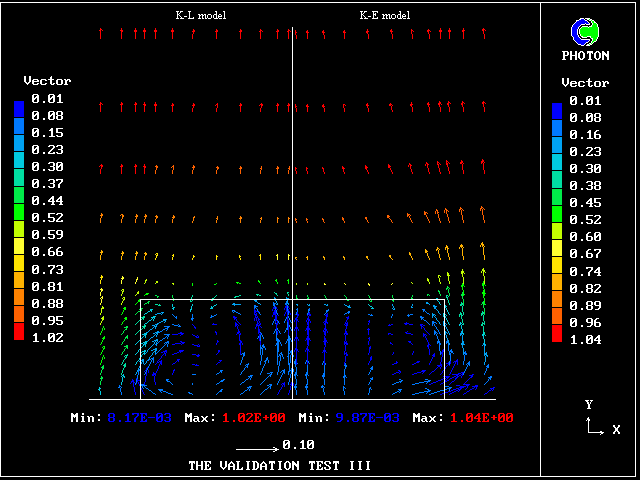
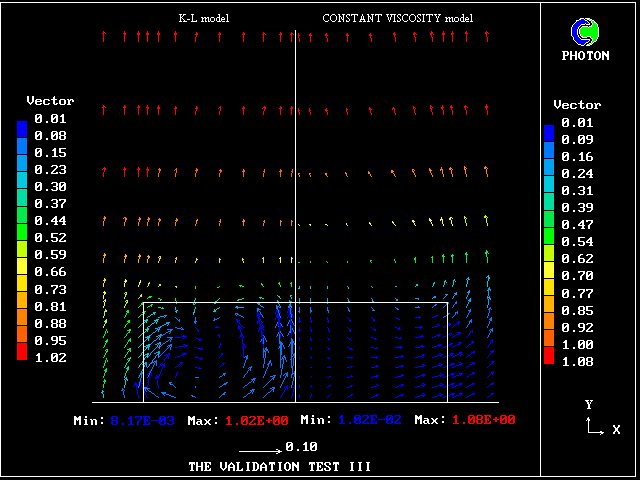
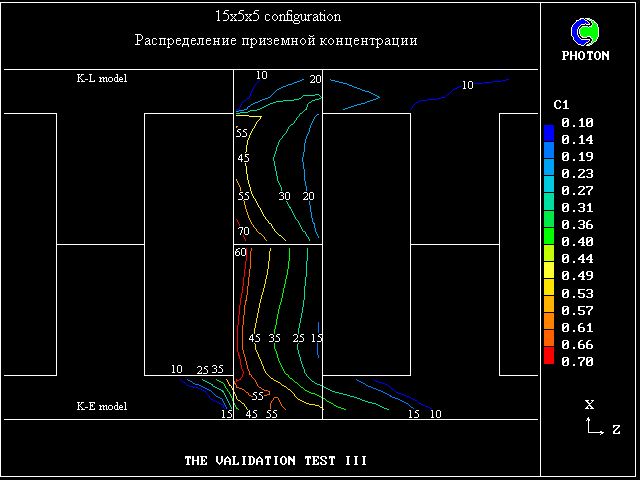
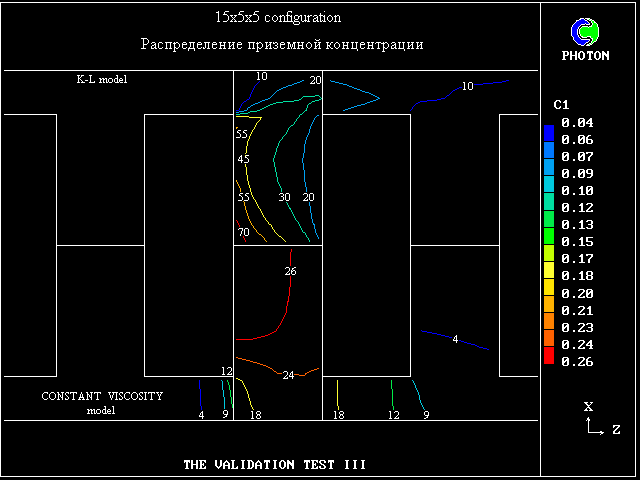
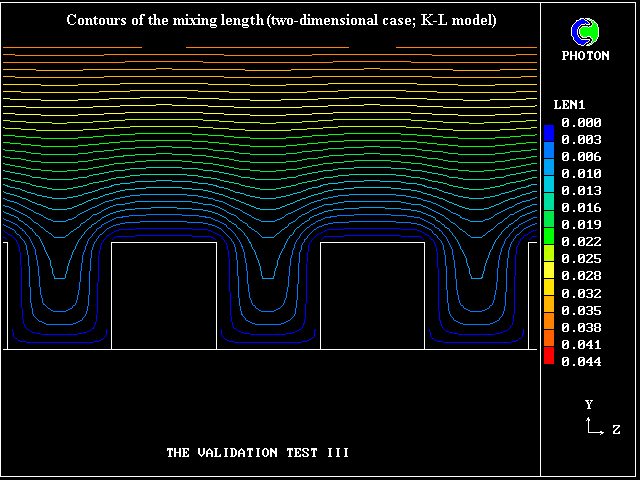
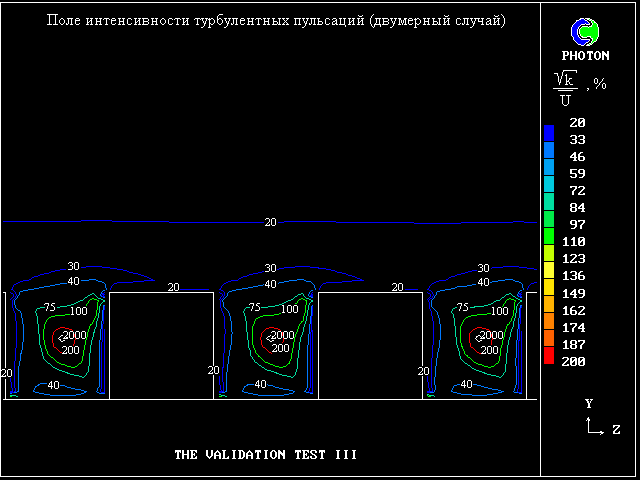
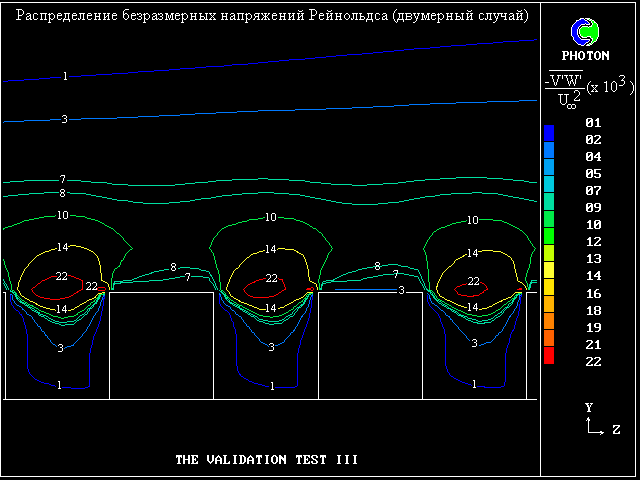
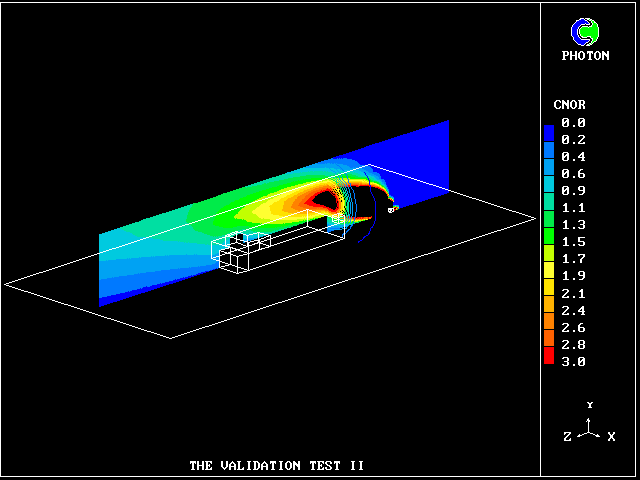
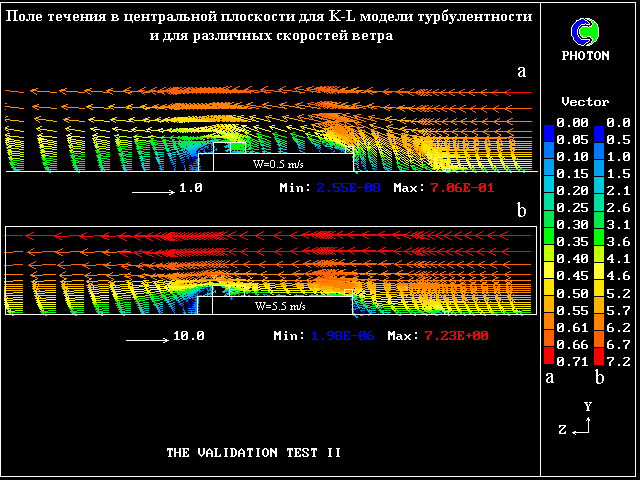
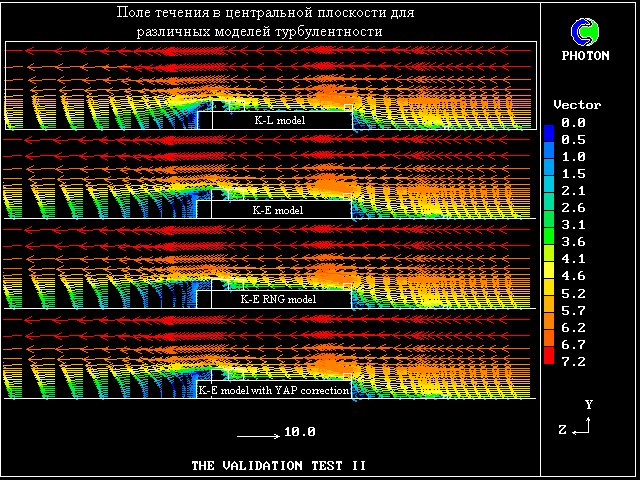
Gallery 3 


Pic. 25. Comparison of ground level concentrations fields, obtained by means of k-l model and model with constant eddy viscosity coefficient under bricks configuration 1055 (the top view). Pic. 26. Comparison of ground level concentrations fields, obtained by means of k-l and LVEL turbulent models under bricks configuration 1055 (the top view). Pic. 27. Airflow fields behind the buildings, obtained by means of k-l and k-e turbulent models under bricks configuration 1555. Pic. 28. Airflow fields behind the buildings, obtained by means of k-l model and model with constant eddy viscosity coefficient under bricks configuration 1555.
Pic. 29. Comparison of ground level concentrations fields, obtained by means of k-l and k-e turbulent models under bricks configuration 1555 (the top view). Pic. 30. Comparison of ground level concentrations fields, obtained by means of k-l model and model with constant eddy viscosity coefficient under bricks configuration 1555 (the top view). Pic. 31. Mixing length distribution along upwind direction (two-dimensional case). Pic. 32. Turbulent pulsation intensity along upwind direction (two-dimensional case).
Pic. 33. Normalized Reynolds stress distribution along upwind direction (two-dimensional case). Pic. 34. Following 9 pictures were take from another project devoted to PHOENICS validation. Presented here results were compared with data also obtained in a wind tunnel.
    In the wind tunnel the dispersion parameters of pollutant in isolated building wake are determined. The building was made at 1/75 scale and had a simple rectangular plane form with a flat roof on which there were two penthouses (one - big, angular form, at leeward side of the building, other - less size, at the same angle of building at windward side). Besides at leeward side of building was placed a small annexe the same height as building. The rectangular building base had the following size: length - 472 mm, width - 181.3 mm and height - 63.2 mm. Big penthouse had height - 39.3 mm, small - 24.7 mm.
    Picture depicts helium plume structure from the ground level source. Pic. 35. Flow field in section, including source and central axis of building base at various wind speeds.
    In the wind tunnel neutral boundary layer was sumulated. With the mean longitudinal velocity of about 5.5 m/s at the main building height, this gives Reynolds number of 22000 upwards based on the main building height (BH).
Helium gas was chosen to serve as the contaminant source. It is very buoyant with a density only 1/7  that of air. The point source was a small (10 mm high by 13 mm diameter) cylindrical shape aerator, similar to those found in fish tanks. Releasing helium gas was at a rate of 0.001 m3/s. The distance between the source and the building winward was 5 BH. The source was set on the centre-line of the building. The building was arranged its long side along main air stream. Pic. 36. Comparision of flow pattern obtained by means of various turbulent models.

To the Top |  Back  | Further


Main Page | Projects | News | What's CXDAVI? | Download
Gallery | Links | About Author | E-mail | Guestbook


Rambler's Top100
小邪泄褌 褍锌褉邪胁谢褟械褌褋褟 褋懈褋褌械屑芯泄 uCoz